Instagram Engagement Rate Benchmarks and Analytics
Sep 28, 2026 · 15 min read
Instagram's average engagement rate fell from 0.50% in 2025 to 0.48% in early 2026, then reached 0.45% in Q2 2026, according to Socialinsider's Instagram benchmark. That decline matters, but the number alone doesn't tell a marketing director whether content is becoming less relevant. The denominator may have changed, the account may have grown, or the publishing mix may have shifted toward formats with different interaction patterns.
A useful Instagram engagement rate is therefore less like a universal grade and more like a measurement instrument. It connects audience exposure with observable action, but the result depends on whether you divide interactions by followers or impressions, which formats you compare, and whether the benchmark reflects your account's scale. Treating every percentage as interchangeable produces confident but invalid conclusions.
Defining the Core Metric and Recent Platform Shifts
Instagram engagement rate measures how actively people respond to content relative to a defined audience or exposure base. Depending on the reporting setup, engagement can include likes, comments, saves, shares, and other recorded interactions. The metric makes account comparisons more useful because raw totals favor larger audiences, while a rate relates interaction volume to a reference point.
A large brand may receive more total interactions than a smaller creator while generating a lower percentage. A smaller account may show the higher rate because a more concentrated audience responds to a greater share of its content. The comparison is valid only when the accounts use the same denominator, interaction definition, and reporting period.
Analytical principle: A rate without its denominator is incomplete evidence.
The platform-level average introduced above becomes meaningful only after the calculation method is clear. An aggregate benchmark describes the accounts and content included in the dataset. It does not diagnose an individual account. Changes in the average can reflect shifts in account mix, distribution, format selection, or measurement practice rather than a uniform change in audience interest.
What the rate can and can't tell you
The metric supports several practical questions:
- Content resonance: Are viewers taking action after exposure?
- Audience responsiveness: Does the current follower base react consistently?
- Format efficiency: Does a Reel, carousel, or image generate a stronger response under the same formula?
- Trend detection: Is performance changing relative to the account's own history?
It does not establish business impact on its own. Interaction may occur without qualified traffic, leads, sales, or retention. A comparison also loses validity when one report divides by followers and another divides by impressions.
Methodology can produce materially different benchmark results. Sprout Social's explanation of Instagram engagement rate presents a median of 0.36% across industries, a benchmark of 0.48%, and figures near 3% under another calculation approach. Those values should not be combined into a single performance scale. Each belongs to a different measurement context.
For marketing reporting, the formula should sit beside the percentage, together with the account scope, content formats, interaction definition, and period covered. That metadata lets analysts distinguish a real change in audience response from a change in measurement. It also makes format-level comparisons defensible before the results are consolidated in a scheduler or dashboard.
Calculation Methods and What They Actually Measure
The two most useful formulas answer different questions. A follower-based rate asks how much of the account's nominal audience interacted. An impressions-based rate asks how efficiently the content converted exposure into interaction.
Follower-based measurement
Use this formula when you want an audience-level view:
Follower-based engagement rate = total engagements ÷ follower count × 100
For a single post, add the interactions included in your reporting definition, then divide by the account's follower count. For an account-level report, calculate the rate consistently across the selected posts and summarize the distribution rather than mixing formulas.
This method is practical for public competitive analysis because follower counts are generally observable, while impressions usually aren't available for other accounts. It also provides a stable reference for evaluating audience affinity over time. Its limitation is equally important: not every follower sees every post, so the denominator represents potential audience size rather than actual exposure.
Impression-based measurement
Use this formula when you're evaluating content efficiency among delivered views:
Impression-based engagement rate = total engagements ÷ total impressions × 100
Impressions count exposures, including repeat views from the same person. A post may therefore have more impressions than unique viewers. The result measures how often exposure generated an interaction, which makes it useful for judging the strength of a hook, creative treatment, or message after distribution.
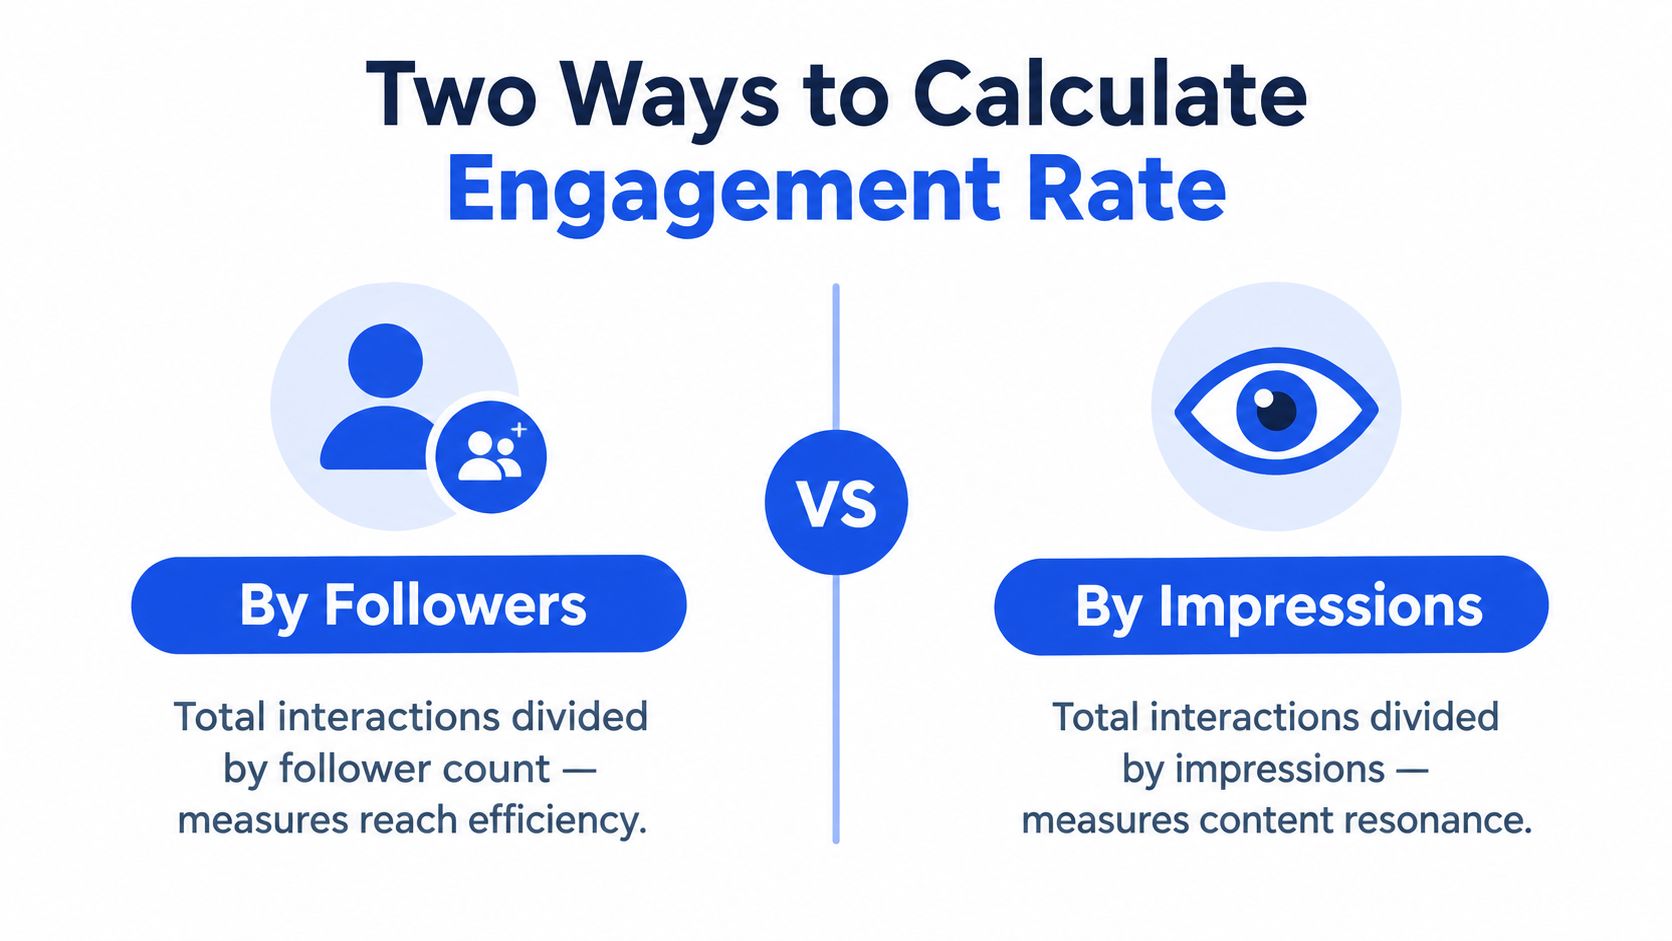
Consider a post with 240 total engagements. If it has 12,000 followers, the follower-based rate is 2%. If the same post records 30,000 impressions, the impression-based rate is 0.8%. These figures aren't competing answers. They describe different layers of behavior, and the example uses hypothetical values to show the mathematics rather than a benchmark.
Build a reporting contract
Before comparing posts, document four choices:
- Engagement definition: Specify whether the numerator includes likes, comments, saves, shares, or another fixed set of interactions.
- Denominator: Label every report as follower-based, reach-based, or impression-based.
- Time window: Allow enough time for interactions to accumulate before finalizing a post comparison.
- Aggregation method: Decide whether you'll report the mean, median, or post-level distribution, and apply that choice consistently.
A team that needs a broader framework for defining inputs, ownership, and reporting can consult this engagement measurement system from Mallary.ai. The value is methodological discipline, not a supposedly universal percentage.
This video offers a visual walkthrough of the calculation logic:
Evaluating Benchmarks by Account Size and Industry
Follower count changes the meaning of an engagement rate. Smaller accounts often have more concentrated audiences, while larger accounts reach a broader mix of highly active and less responsive followers. As an account grows, the percentage rate will often decline even when the number of interactions rises. Buffer's Instagram engagement guidance identifies follower count as a major factor and distinguishes follower-based measurement from impressions-based measurement.
The mechanism is straightforward. If followers increase faster than interactions, the rate falls. That movement does not by itself indicate weaker content. Distribution may have expanded beyond the account's most responsive audience, or the denominator may now include people who do not regularly see or act on each post.
Account size should therefore shape the comparison set. A smaller account can post a higher percentage because a larger share of its audience is familiar with the account or actively follows its updates. A large account may generate substantially more comments, saves, and shares while producing a lower percentage against its follower base.
A benchmark hierarchy
Use benchmarks in this order:
- First, compare like with like: Match the denominator and engagement definition.
- Second, compare within account size: Evaluate the account against peers with a similar scale.
- Third, compare formats: Separate Reels, carousels, and images rather than blending them.
- Fourth, compare industries carefully: Treat vertical comparisons as directional unless the methodology is identical.
- Finally, prioritize internal history: Your own consistent baseline is usually more actionable than a generic platform average.
The divergent figures cited earlier, including the median, benchmark, and higher rate produced by another formula, should be treated as different reference points rather than combined into one scale. The formula, sample, account mix, and reporting period determine what each benchmark can support.
Performance tiers by follower count
The table below avoids invented rate bands. It provides a decision framework for interpreting account size while keeping platform averages separate from account-specific performance.
| Account Size Tier | Average Rate Expectation | Strong Performance Indicator |
|---|---|---|
| Smaller account | Often higher percentage engagement because the audience is more concentrated | Sustained performance above the account's own baseline, with meaningful comments, saves, or shares |
| Growing account | Declining percentage can accompany audience expansion | Stable or rising absolute interactions while the rate remains consistent with comparable peers |
| Mid-sized account | Greater variation as audience composition broadens | Strong results after separating formats and comparing the same denominator |
| Large account | Lower percentage rates are common at scale | High-quality interaction and improving efficiency relative to comparable large accounts |
| Very large account | Platform median comparisons become less informative | Repeatable format-level performance and strong absolute interaction volume |
Industry affects behavior through factors such as purchase cycles, audience involvement, and the type of response a post requests. The evidence here does not support a complete industry-by-industry rate table, so a category label should not determine a precise target. Set a baseline from comparable posts, record the formula, and assess change against the account's own historical distribution. This approach separates genuine performance improvement from shifts caused by audience growth, format mix, or measurement choices.
How Media Format Dictates Interaction Volume
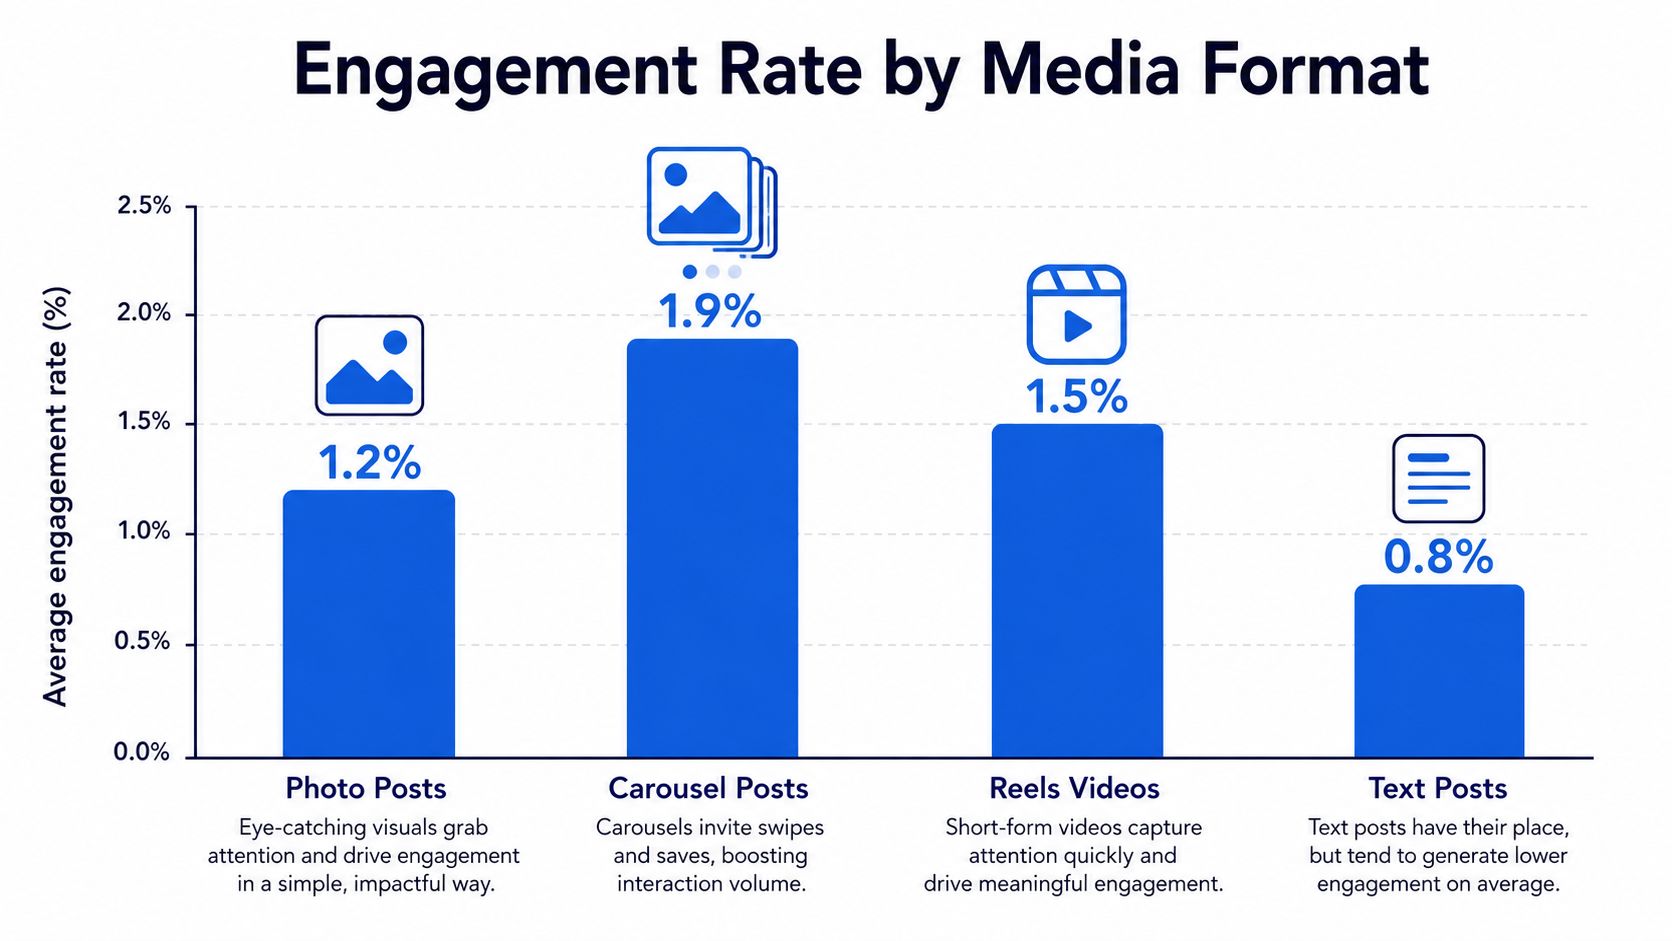
Instagram engagement changes with the content mix. Socialinsider's 2025 format breakdown measured Reels at 0.52%, carousels at 0.55%, and image posts at 0.37%. In the cited comparison, image performance declined from 0.45% to 0.37%. These figures do not establish a permanent winner. They show how an account-level average can shift when publishing frequency moves between formats.
Format changes the number and type of actions available to viewers. A carousel can develop an explanation across several panels, encouraging continued attention, saves, or shares. A single image communicates more immediately and may create fewer interaction points. Reels can extend discovery beyond followers, but broader exposure does not automatically produce a higher engagement rate.
Read format data as a portfolio
A useful format comparison separates three measurements:
- Efficiency: Which format produces the strongest rate with the same denominator?
- Distribution: Which format reaches people beyond the existing follower base?
- Interaction quality: Which format generates comments, saves, and shares instead of mainly lightweight reactions?
Report efficiency through engagement rate, distribution through reach and impressions, and interaction quality through the numerator's individual components. Combining these outcomes into one score can undervalue a format built for reach or overvalue one that generates interactions from a narrower audience.
Assign each format a defined role. Use Reels when discovery and wider distribution are priorities, carousels when the subject benefits from sequence or reference value, and images when a concise visual statement fits the objective. Compare each format with its own historical baseline, then review the format mix before interpreting a change in the account-level rate.
The key question is whether the format and denominator match the intended outcome. A shift toward Reels may alter reach and engagement differently, while a shift toward carousels may increase interaction depth without producing the same distribution. Separating these effects prevents a publishing change from being mistaken for a change in audience interest.
Centralizing Metric Tracking with Scheduler Analytics
Teams often lose analytical consistency before they lose creative momentum. Native dashboards, exported files, campaign documents, and manually maintained spreadsheets can each contain useful figures, but the manager still has to align post dates, formats, accounts, denominators, and reporting windows.
A unified scheduler reduces that reconciliation work by placing publishing context beside performance data. The useful view isn't just a calendar of scheduled posts. It's a calendar where each published item can be associated with its reach, interactions, engagement rate, account, format, and reporting period.

A practical operating sequence
- Define the metric fields: Record the numerator components and label the denominator explicitly.
- Tag the content: Mark each post by format, campaign, topic, and account.
- Wait for a consistent measurement window: Don't compare a newly published post with an older post whose interaction period is complete.
- Sort by the right outcome: Review engagement rate for efficiency, reach for distribution, and absolute interactions for workload and community volume.
- Inspect the underlying posts: A ranked list is only useful if the team can examine the creative, caption, timing, and audience context that produced it.
A tool such as Social Media Scheduler's Instagram scheduler can keep Instagram planning and publishing in a shared workflow. Its stated analytics include reach, engagement, and engagement rate, with sortable top-performing posts and profiles as data arrives. That setup supports faster diagnosis because the manager can connect the result to the original scheduling decision without moving between unrelated systems.
Why centralization improves interpretation
Centralization doesn't make the metric more accurate by itself. It makes errors easier to detect. When every post carries a visible format and denominator label, a manager is less likely to compare an impression-based Reel rate with a follower-based carousel rate or attribute a performance shift to timing when the content mix changed.
It also creates a more useful feedback loop. A publishing calendar records intent, while analytics record outcomes. Keeping both in one timeline lets teams ask whether the posts they planned delivered the intended audience response, then adjust future slots and formats with evidence rather than memory.
Applying Historical Data to Future Content Planning
Historical engagement data becomes strategically valuable only when it changes a future decision. A dashboard that identifies a high-performing post is descriptive. A planning system becomes analytical when it connects that result to a repeatable choice about format, timing, topic, or channel adaptation.
Start with a learning dataset rather than a highlight reel. Include strong, average, and weak posts, and preserve the variables that could explain the difference. At minimum, record the post format, publication time, topic, creative treatment, caption approach, reach, impressions where available, interaction components, and the selected engagement-rate formula.
Convert observations into hypotheses
A useful recommendation has a testable form:
- Observation: Carousels show stronger follower-based interaction than image posts in the same account history.
- Hypothesis: Step-by-step educational structures encourage more active responses from this audience.
- Planning action: Schedule more posts using that structure while retaining a comparison set.
- Measurement: Compare format-specific rates and interaction composition after the agreed window.
The hypothesis matters because a raw recommendation such as “publish more carousels” doesn't explain whether the result came from the format, the topic, the hook, or the audience segment. Change one major variable at a time when the team needs causal clarity.
AI-assisted planning can help surface recurring patterns in historical results and suggest publication slots, content structures, or formats for review. The recommendation still needs human validation. A model can identify that a topic and format co-occur with strong interaction, but the marketing team must decide whether the pattern fits brand priorities, campaign timing, and available creative resources.
Tailor once, then adapt by channel
Cross-platform planning adds another layer. The same idea may require different copy length, media treatment, call to action, or publishing format on Instagram, LinkedIn, TikTok, or another network. Reusing the strategic intent is efficient, but copying the final asset unchanged can distort the audience response and make channel comparisons less meaningful.
A structured plan for a month of content can help teams turn those observations into a calendar with deliberate variety. Build the schedule around hypotheses, mark which posts are tests, and reserve enough comparable content to distinguish a genuine pattern from an isolated result.
The most useful output of historical analysis isn't a permanent rule. It's a sharper next experiment.
Building a Continuous Testing and Optimization Loop
A static benchmark is a poor operating target because the denominator, audience composition, and content mix keep changing. Use the Instagram engagement rate as a diagnostic signal, then maintain a cycle that records the baseline, isolates a variable, measures the result, and updates the plan.
The loop in practice
Benchmark. Capture the current rate by format and denominator. Record the interaction components separately so a change in comments isn't hidden by a stable total.
Test. Change one meaningful variable, such as the opening frame, carousel structure, topic angle, or publication slot. Keep the formula and reporting window constant.
Measure. Compare the test against a relevant baseline. Don't use a follower-based result to validate a hypothesis about exposure efficiency, and don't treat a higher rate as automatically better if reach or business outcomes deteriorate.
Iterate. Retain the learning, revise the next creative brief, and run another controlled comparison. A guide for consistent social presence can complement this measurement discipline by helping teams maintain a dependable publishing practice while they test.
A monthly review checklist
- Formula control: Confirm that the numerator and denominator stayed consistent.
- Format separation: Review Reels, carousels, and images independently.
- Scale context: Interpret rate changes alongside follower growth and absolute interactions.
- Distribution context: Compare reach and impressions with engagement efficiency.
- Creative diagnosis: Inspect hooks, structure, captions, and calls to action in the strongest and weakest posts.
- Planning decision: Convert one validated learning into the next calendar's brief.
The opening seconds and framing of a post can influence whether a viewer continues or scrolls, so teams should treat creative construction as part of measurement rather than as a separate discipline. Resources such as hooks that stop the scroll are most useful when the team tests the hook against a clearly defined baseline.
The correct question at the next review isn't “Did we reach the benchmark?” It's “What changed, which denominator captured that change, and what should we test next?”
Social Media Scheduler brings drafting, cross-platform scheduling, publishing, and post analytics into one calendar, including reach, engagement, and engagement rate views. Use it to label formats, compare consistent formulas, and turn historical Instagram results into the next set of measurable content tests, then visit Social Media Scheduler to build that workflow.