Key Performance Indicators Social Media Explained
Oct 24, 2026 · 14 min read
Key performance indicators for social media must reflect audiences moving across services. A typical internet user spends 2 hours and 21 minutes a day on social media and uses 6.83 platforms a month, according to DataReportal's Digital 2025 analysis. A like total on one network alone cannot show whether a post reached new people or met its objective.
Judge engagement against a fair baseline for that account: the same platform, format, audience scale, and objective. Rates vary across networks and account sizes, so a cross-network leaderboard can rank audience differences rather than publishing performance.
Why Social KPIs Now Span Many Platforms
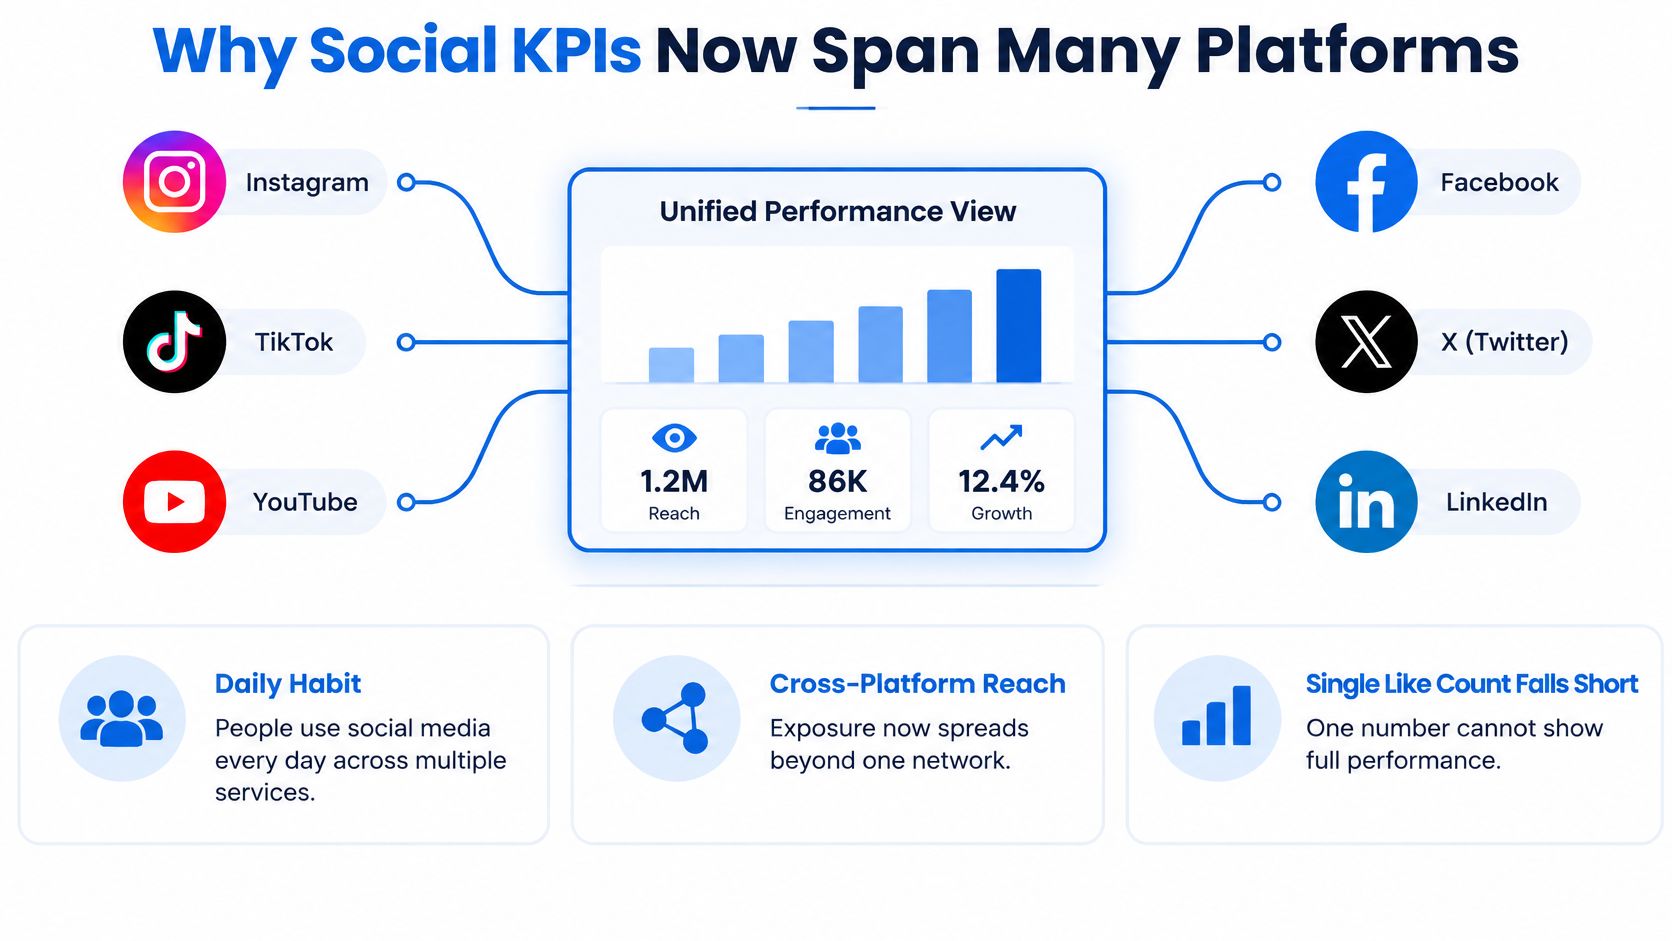
Social performance now spans several services, so a follower count on one network cannot describe the full audience or a campaign's contribution. The measurement challenge is to distinguish repeated exposure from new reach, then judge each channel against the role it serves.
The same people, more than once
An all-account average can hide a post that appears lively on one network but adds few new people because much of its audience has already encountered the idea elsewhere. Reach, impressions, audience growth, publishing frequency, and engagement need to be read together to separate repeated contact from incremental exposure.
The useful unit of analysis is the audience journey across services, with channel-level detail preserved alongside a consolidated view. Blending channels into one score conceals whether each is doing its intended job. For teams planning posts across networks, an Instagram scheduler can help keep publishing organized without treating Instagram's results as interchangeable with another platform's.
Instagram might carry a campaign's visual cut while another network draws conversation. Those activities call for different success measures, even when they support the same campaign.
What an average hides
Results can vary by week, campaign, or country. A global or account-wide average may therefore point to a different decision than the audience slice a team intends to reach. Use the breakdown that matches the publishing decision.
- Daily habit: People return across several services, so more activity on one channel may add little exposure if the same audience has already seen the content elsewhere.
- Cross-platform reach: Each network reports exposure within its own measurement system, which makes a combined total difficult to interpret without checking for overlap.
- One like count: A like records a response, but not whether the person was new, had seen the idea before, or moved toward the campaign objective.
Practical rule: If the consolidated figure and the country-level figure point in different directions, use the country-level slice when deciding whether the campaign reached its intended audience.
Teams that automate social media monitoring can bring these channel and audience cuts into a repeatable review. The decision should change when the relevant account-level baseline changes, not just because one network's number looks larger.
Six Social Media KPIs from Exposure to Action
Read the set as a funnel. Distribution is not response, and response is not a business result. Six numbers cover that path if you keep each one's denominator honest.
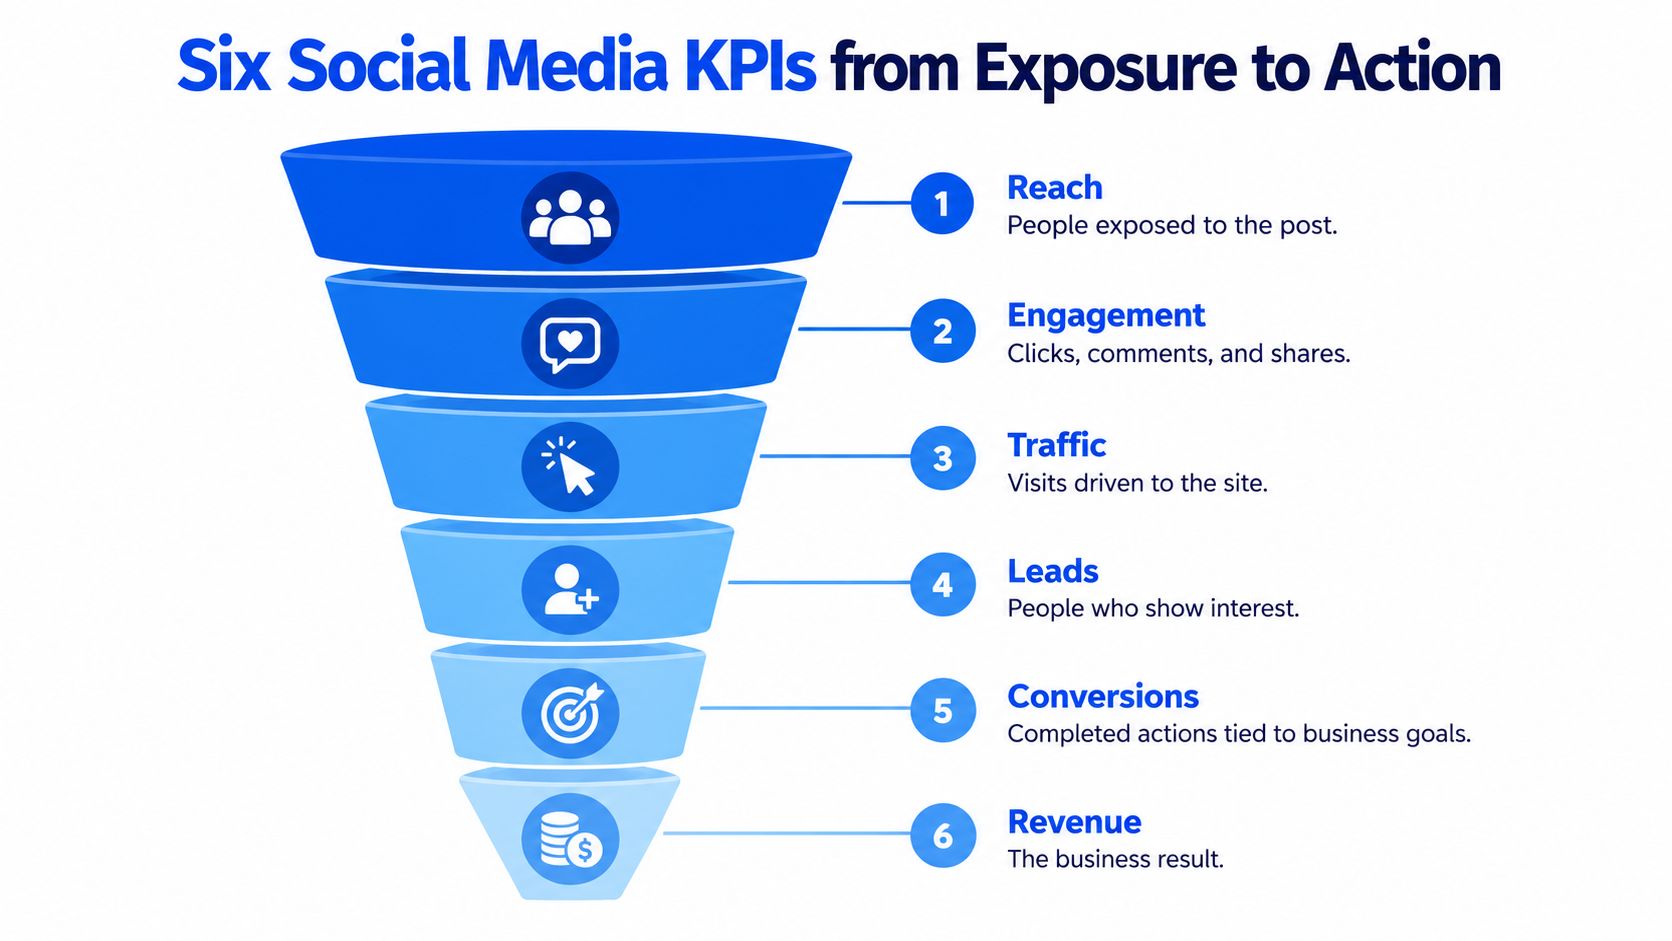
Reach is people exposed. Impressions are times the content was shown, so one person can count more than once. Engagement is the actions taken, such as reactions, comments, and shares. Engagement rate divides those actions by exposure. Academic measurement examples define the impressions version as total post engagement divided by impressions, then multiplied by 100, as set out in this engagement-rate measurement note. Click-through rate is clicks against that same exposure. Conversions are the downstream result the click was meant to start.
Same 240 actions, two different posts
Take 240 interactions. Against 12,000 impressions the rate is 2.0%. Against 30,000 impressions it is 0.8%. The raw count didn't move. The response among people who saw the post did. Early reporting that stopped at followers, likes, or comments missed that denominator, so a widely shown post looked like a win because more people had a chance to tap.
Store the numerator and the denominator. When a network revises a definition or a reporting window, you can still audit the history. Segment by platform, format, publish time, and account size. One global benchmark will misrank a Reel against a text post, and a small community account against a large brand page.
| Pair you see | What it supports |
|---|---|
| High reach, low rate | Awareness can still be the win if the people exposed were the ones you wanted |
| Lower reach, high rate | Stronger relevance or a tighter community response |
| Clicks without conversions | The post created intent the landing step didn't finish |
| Conversions on modest reach | The objective moved even if the feed totals look quiet |
Saves, shares, clicks, video completion, and conversions stop likes from standing in for the whole funnel. A like is a diagnostic. A save or a share is a stronger sign that someone wanted the idea again or passed it on. Video completion tells you whether the middle of the cut held. None of those substitutes for a conversion when the objective was a lead or a sale.
Campaign measurement insights from Clipatra are useful here because influencer work fails in the same place: a visible total with no stored inputs. The math above is the vocabulary. It is not yet a license to rank TikTok against YouTube.
Engagement Rates That Are Not Interchangeable
A 2025 global benchmark study of brand accounts found average engagement of 5.0% on TikTok, 3.6% on Instagram, and 3.4% on YouTube, across 970, 2,967, and 630 accounts. Those figures come from the Dash Social H2 2025 benchmark. They are not a winner's table. TikTok and Instagram used (likes + comments + shares) divided by reach. YouTube used interactions divided by video views.
2025 Brand Engagement Rates Are Not the Same Math
| Platform | Accounts studied | Engagement counted | Denominator | Average rate |
|---|---|---|---|---|
| TikTok | 970 | Likes, comments, shares | Reach | 5.0% |
| 2,967 | Likes, comments, shares | Reach | 3.6% | |
| YouTube | 630 | Interactions | Video views | 3.4% |
Line those rates up and Instagram can look “behind” TikTok, or YouTube can look almost tied with Instagram, when the units aren't the same. A reach-based rate and a view-based rate answer different questions. Comparing them creates a false ranking even when audience behavior is similar.
What the export has to keep
Store reactions, comments, and shares as separate counts. Keep the native denominator. Show the platform's own rate, and if you need a cross-channel view, label it as normalized so nobody treats it as the network's official figure. Data Hunters Agency's engagement measurement guide walks through why that bookkeeping matters once several exports land in one sheet.
Averages mislead inside a single network too. A viral post pulls the mean away from the posts you can repeat. Median or percentile bands belong next to the average, or the mean becomes a trophy for an outlier.
Shares and comments describe an active response. Reach and views describe distribution. Those are different jobs, and a single rate collapses them.
A lower rate on much larger qualified reach can still produce more total engagements and more awareness. Ranking by rate alone will push you to shrink distribution in order to look efficient. Compare posts only inside the same platform, format, audience size, and time window. The opening line still has to earn the stop, which is why hooks that stop the scroll belong in the creative review, not in the rate formula. Account size is the next cut, and it changes the target again.
Benchmarks That Match Follower Scale
A nano creator and a large brand should not share one engagement target, even on the same platform. Favikon's 2025 benchmark covered more than 6 million active profiles on Instagram, TikTok, LinkedIn, and YouTube. Active meant a post in the previous 30 days. Profiles were split into 12 follower-size ranges.
The pattern is structural, not a moral score. Top-quartile Instagram engagement sits above 3.4% for nano influencers. LinkedIn's nano top quartile sits above 2.4%. YouTube's nano top quartile begins around 0.8%. Follower count, audience intimacy, format, and recommendation-driven distribution change both exposure and the chance someone interacts. A small account often talks to people who already know the creator. A large account is more often shown to people who don't.
Build the peer cohort first
Don't turn those quartiles into a universal goal. Benchmark each account against a peer cohort.
- Same platform. A LinkedIn rate doesn't grade a YouTube rate.
- Same follower band. Twelve ranges exist because the curve isn't flat.
- Same content type. A short video and a static post don't share a denominator story.
- Same active-post rule. A profile that posted in the last 30 days isn't comparable to a dormant one you revived for a campaign.
Prefer percentile targets to a single threshold. Pair the rate with absolute engagements, reach per follower, follower growth, saves or shares, and downstream conversions. A pretty rate with falling reach per follower is a shrinking room, not a healthier one.
A small account moving from the 50th percentile to the 75th is a real change in its own history. Beating a large brand's raw rate usually isn't.
Learning systems should optimize for that movement. If recommendations chase the highest raw rate in the whole export, they will keep favoring the smallest, most intimate accounts and ignore whether a larger account is climbing its own band. The number that should change a publishing decision is the account's percentile inside its cohort, not a leaderboard that mixes follower sizes.
What a Typical Post Looks Like
“Which platform wins on engagement?” is the wrong question, and the averages make it look answerable. Recent cross-platform analysis found X averaged 328 engagements per post, against 58 on Threads and 21 on Bluesky, while the median was only about four interactions per post across the three. That gap is reported in this comparison of X, Threads, and Bluesky. A few viral posts inflate the mean. A content plan built on the mean will chase outliers the account doesn't repeat.
The weekly report that flatters X
Picture a Monday export. X's average looks dominant, so the plan shifts two extra posts there and cuts the quieter network. Re-rank the same period by median and the three networks sit near a handful of interactions. Re-rank again by non-follower reach and a modest Thread may have introduced more new people than the viral X post that your existing followers already liked. The celebration was an artifact of the mean.
Most KPI guides skip the habits that would have caught it.
- Median and a percentile range: So one viral post can't set next week's cadence.
- Follower-normalized results: So a large account's raw total doesn't masquerade as efficiency.
- Non-follower reach, kept separate: So you can see distribution beyond the people who already follow you.
- Outcomes apart from diagnostics: Qualified leads, sales, or retention are not the same family as likes and comments.
The practical question is what a fair baseline is for this account, this format, this audience, and this objective. Channel-specific benchmarks plus a rolling comparison to the account's own history answer it. A cross-network leaderboard doesn't. Treat the figures above as a distribution, not a trophy, and the publishing decision changes from “post more where the average is largest” to “repeat the format that beats this account's own median.”
Choosing a Workflow That Keeps Fair KPIs
Headline growth on a newer network is not the same thing as attention or fit. Reporting on whether anything can replace X puts Threads at 115.1 million daily users by July 2025, with about eight minutes a day there versus 31 minutes on X. A January 2025 sample found daily-or-greater use of 26% on X, 18% on Threads, and 14% on Bluesky, and usage varied substantially by generation. A fast-growing platform can still deliver weaker attention, lower purchasing intent, or an audience that doesn't match the brand.
An early-stage scorecard
Before reliable conversion data exists, don't grade the new channel on follower growth alone. Run a defined test window and combine:
- Incremental reach: People you weren't already hitting on the networks you keep.
- Returning viewers: A second look, not a one-day spike.
- Qualified profile visits, saves, or shares: Signals that the audience treated the post as worth keeping or passing on.
- Audience fit and publishing effort: A dense pocket of the right people can beat a wide pool of the wrong ones, but only if the extra drafting time is honest.
- Assisted conversions: Credit for a later action, not only a last click.
A smaller channel can be the better bet when relevant conversations or leads are denser. User-growth headlines alone shouldn't move budget.
Spreadsheets or one calendar
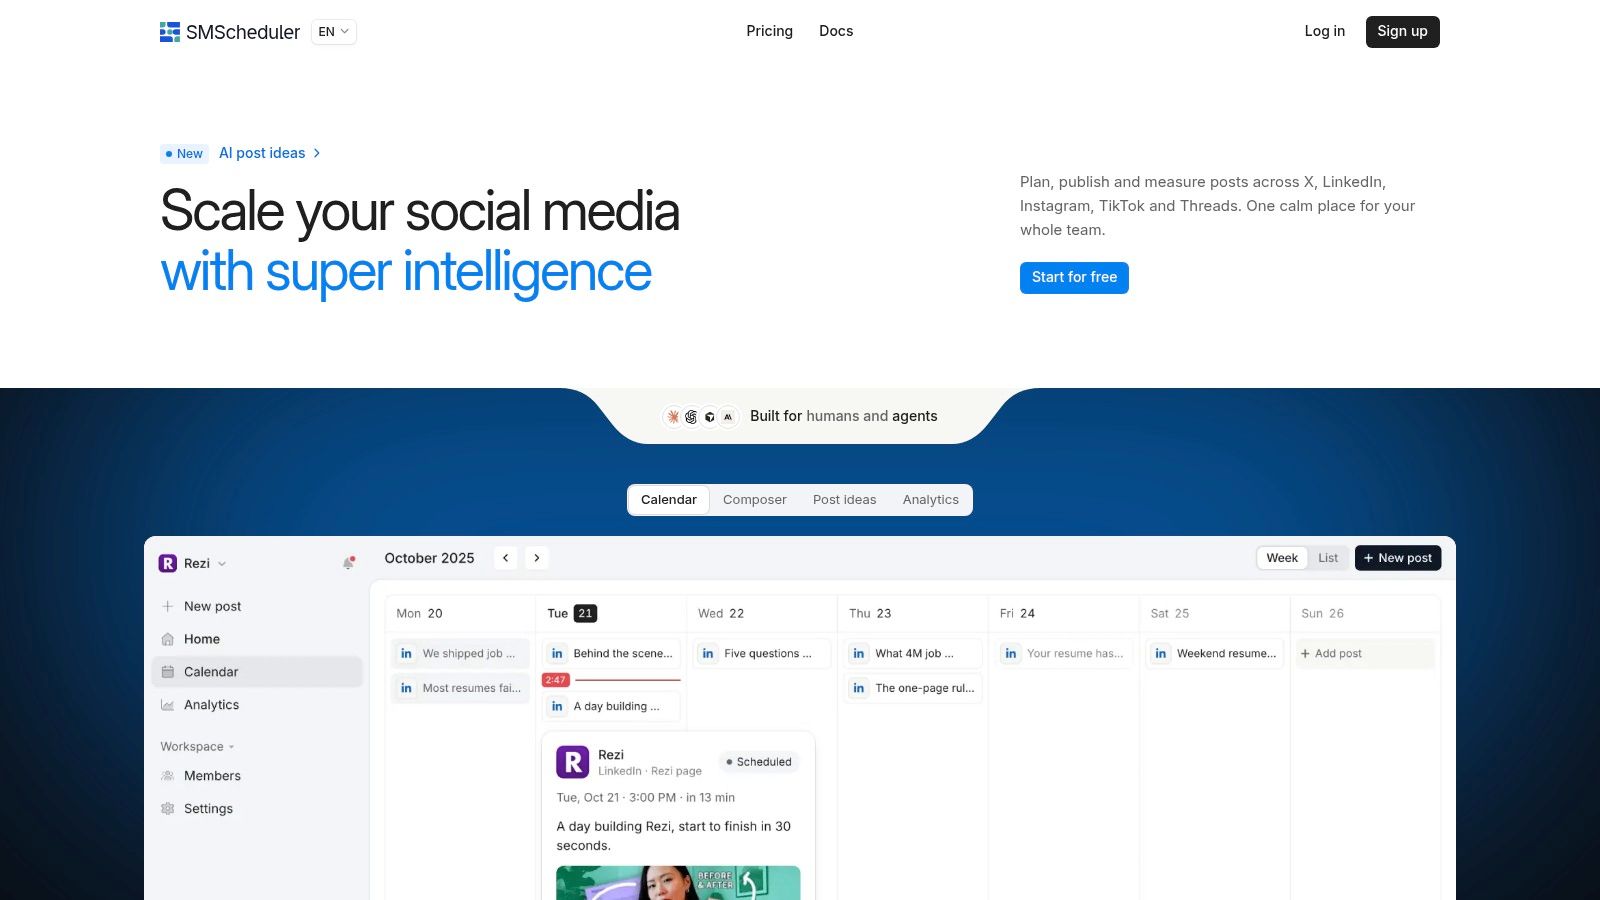
Native apps plus spreadsheet exports preserve each network's definitions, which is good, and they also invite someone to paste a reach-based rate next to a view-based rate, which is how false rankings start. The other approach is one calendar that schedules to X, LinkedIn, Instagram, Threads, Facebook, TikTok, YouTube, and Bluesky, tailors a draft per channel, and reports reach, engagement, and engagement rate with top posts over a chosen period.
Social Media Scheduler is that consolidated option. Posts move through draft, queued, and published states. Recommendations draw on past results. Storage is limited to what publishing and reporting need. It doesn't replace each network's native definitions, and it shouldn't. The decision criterion is simpler than a feature list: does the workflow preserve channel detail and the original denominator, while still showing one timeline?
That timeline only helps if the week itself is planned. A weekly content system keeps the test window from turning into another pile of exports. The short walkthrough below shows how a single calendar holds those channels without flattening their metrics.
A Weekly Review You Can Run Next
Run this once, on the same weekday, after each post has had its reporting window. One objective for the week. Then pull only the pair that matches it.
For awareness, read reach beside impressions so you can see whether extra frequency is mostly the same people. For relevance, read engagement volume beside the rate, and don't let the rate win if the audience was tiny and off-target. For traffic intent, use click-through rate against the exposure you bought or earned. For outcomes, use conversions, and keep likes in the diagnostic column.
Compare each post only with the same platform, format, follower band, and recent window. Put the median next to the average before you let one viral post rewrite the calendar. If the mean and the median tell different stories, the median is the post you can plan around.
One change, one test
From the account's own history, name one change: a timing shift, a format you will repeat, or a channel you will quiet. Then name one test on a newer network. Score it on incremental reach, return visits, saves or shares, audience fit, effort, and assisted conversions. Follower growth is a footnote in that test, not the verdict.
If the team already drafts in several apps, put the coming week on a single calendar, keep per-channel copy, and review reach, engagement, and engagement rate from that same place once the window closes. The review is finished only when it changes a decision. Repeat the format that beat this account's median. Keep the new channel in test, or stop it, based on the scorecard rather than the user-growth headline.
The number that should move next week's plan is the one tied to this week's objective, inside a fair baseline. Everything else is context.
Social Media Scheduler puts drafting, per-channel tailoring, and a single calendar in one place, then reports reach, engagement, and engagement rate without forcing every network onto the same denominator. That is the view this kind of weekly review needs if you publish beyond one app. See how it fits your accounts at Social Media Scheduler.